Where is the murder rising? Concentration to Cape Town and diffusion within

The national murder rate
One of the most worrying things to come out of the September release of the last year’s crime statistics was the fact that the long decline in the South African murder rate from 1994 has been reversing in the last three years. The national rate in 1994 was about 67 per 100,000. By 2011/2012, this had dropped to about 30 per 100,000. Since then, however, it has risen by about 9% to 33 per 100,000.

On the one hand, this may seem minor – after all, we’re still doing a lot better than ten years ago. But it is worrying that this is the first time in 20 years that we’ve seen three consecutive years of increase in the murder rate. And the pattern is also matched in a number of other crime types, where overall decreases in reported rates over the decade or longer have slowed or turned to increases in the last three years. This is the case, for example, with Public/street robbery (down about 27% since 2005/2006, but up 24% since 2011/2012), Carjacking (down about 12% since 2005/2006, but up 29% since 2011/2012), Common robbery (down about 35% since 2005/2006, and decrease of only 1% since 2011/2012), Burglary at residential premises (down about 15% since 2005/2006, but decrease of only 1.3% since 2011/2012). Declines have been more sustained in reported rates of Common assault and Assault GBH, while Robbery at residential premises and Robbery at non-residential premises have seen major, sustained increases throughout the decade. Still, the increase in the murder rate over the last three years is concerning, especially as it may mark the beginning of a new and as yet poorly-understood upward trend.
Murder rates in the major cities
The Centre of Criminology has created a database of crime figures for the last ten years in the major South African cities – that is (in decreasing order of population size) the City of Johannesburg, City of Cape Town, eThekwini, Ekurhuleni, City of Tshwane, Nelson Mandela Bay, Mangaung, Buffalo City, and Msunduzi. Such city-based comparison and tracking has in the past proven challenging, as the official South African Police Service (SAPS) crime statistics are provided on the police station level and aggregated to the provincial level and the national level – but not on the municipal level. Police precinct boundaries do not correspond with municipal boundaries. By overlaying the boundaries, however, and compiling a list of those stations which have half or more of their area falling within the relevant municipality, one can arrive at an estimate of the number of incidents of each crime type that have been recorded in each municipality. To make these comparable between municipalities of wildly varying size, these figures can then be expressed as a rate per 100,000 people resident within that same area. This is done according to Census 2011 figures for those Enumerator Areas that fall within these same common boundaries.
This procedure reveals the broad variation in murder rates, between lows for the City of Tshwane of about 16 per 100,000 and highs for Nelson Mandela Bay of about 70 per 100,000. The following graph indicates the trends in the murder rates for the four largest cities – Johannesburg, Cape Town, eThekwini, Ekurhuleni, and Tshwane – as well as the average rate for all the nine major municipalities, using 2011 Census figures.

A number of the cities follow a very broadly similar trend to the national rate (albeit in a more unstable pattern), including especially eThekwini, the City of Johannesburg, and the City of Tshwane. In many cases (namely Nelson Mandela Bay, eThekwini, Buffalo City, Msunduzi, and Tshwane) the rate for 2014/2015 is lower than that for 2005/2006, but many have seen increases over the last two or three years. Nelson Mandela Bay, eThekwini, and Buffalo City have all seen considerable change over time but all still rank very high in terms of murder rates. Similarly, Tshwane, Ekurhuleni and Johannesburg have maintained a relatively low ranking. Two municipalities deserve further individual note. First, Buffalo City is the only municipality to have seen a significant decrease in its murder rate from 2013/2014 to 2014/2015. Second, the City of Cape Town is overall a clear outlier from all the others, in that its murder rate has been rising solidly as of 2009/2010, moving it from a mid-range ranking to take a growing lead as of 2012/2013.
Concentration to Cape Town, dispersion within the city
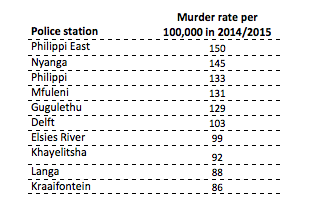
The City of Cape has seen a far larger increase in its murder rate than the national average or the major city average, and larger than any of those other cities. Whereas the national increase since 2011/2012 has been about 9%, Cape Town’s has been about 37%. Indeed, with only about 7% of the national population, Cape Town’s murders have contributed about 4 percentage points to the national increase in the last three years. That is, if Cape Town were excluded from the national total, the national murder rate rise of the last three years would be closer to 5% than to 9%. Cape Town’s murder rate for 2014/2015 is above 60 per 100,000 – as compared to the national rate of 33. Highly populous cities do tend to have higher murder rates than their national averages, but only a handful of cities worldwide, mostly in Central and South America and parts of the Caribbean, have murder rates above 50 per 100,000. Of course, there is considerable variation within Cape Town. The police stations in Cape Town reporting the top ten highest murder rates per 100,000 in 2014/2015, using 2011 Census figures, are:

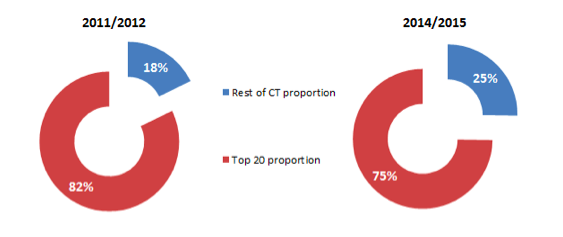
These ten stations, out of the 59 in Cape Town, contributed 1342 murders to the Cape Town total of 2434 murders in 2014/2015 – that’s a total of about 55% of the murders in about 31% of the population. The top ten stations by murder rate in 2011/2012 (which list overlaps largely with this) contributed 59% of the 1650 total city murders. In other words, although the very high murder rate stations do contribute disproportionately to the overall numbers for murder in Cape Town, they are not disproportionately responsible for the increase. Instead we are seeing slightly less concentration in murder in Cape Town, with the stations with the highest murder rates hosting a slightly smaller and apparently shrinking proportion of the city’s total murders. There are a number of ways to represent this dispersion. In 2011/2012, the top 20 stations by murder rates accounted for 82% of the murders in the city. In 2014/2015, they accounted for just 75%. This can be represented so:

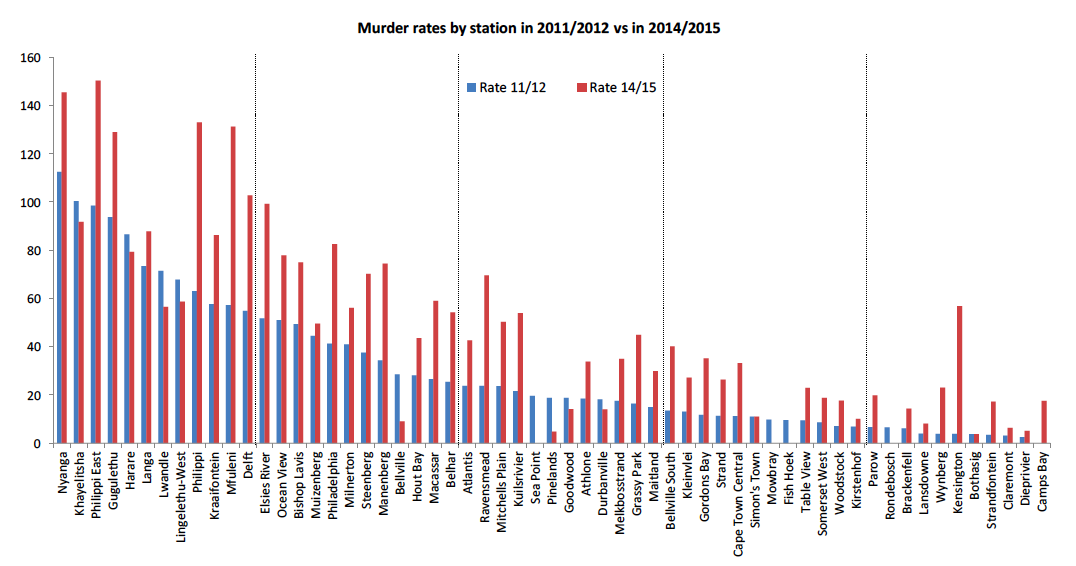
Another way to describe this change is by the quintile shares. Ranking the stations by their murder rates reveals that the top fifth’s contribution to the city’s total murders has dropped by about 11%. These stations are all on the Cape Flats and parts of the Northern Suburbs. The second fifth, with a spread slightly wider across the Northern Suburbs, the Cape Flats, and the Helderberg regions, saw their proportion increase by about 21%. The third and fourth quintiles increased by even larger proportions (31% and 34% respectively). The fifth of the list with the lowest rates, which are largely in the Southern Suburbs, has seen little change from its share of about 1% of the city’s murders. This can be represented so:

Note: these rates at both dates are based on station precinct populations as determined in Census 2011. Stations that have seen growing populations can thus be expected to see higher murder rates here without that reflecting a real increase in their rate of murder.
There is still massive concentration of murder in Cape Town in a relatively small number of precincts. But the rise is happening across a larger proportion of the city. 47 of Cape Town’s 59 stations saw an increase in their number of murders between these dates. A number of the top-ranked stations (including Khayelitsha, Harare, Lwandle, and Lingelethu-West) are actually among the few to have seen decreases.
Possible explanations
It isn’t yet clear why we are seeing this shift in the pattern of murders in Cape Town. One possible reason for the broad increase may lie in the other crime type for which Cape Town presents an outlier from the other major cities: drug-related crime. See the graph below:

Rates of drug-related crime are hard to interpret, given that they fall in the category of crime for which the number of recorded incidents is largely driven not by victim or witness reports, but by the actions taken by police. So an observed increase in the rate of these police-detected crimes may reflect a real increase in the number of such activities occurring, but may equally reflect an increase in policing focus, motivation, and overall effectiveness in discovering them.
Still, it is striking that Cape Town’s recorded rates of drug-related crime have grown to more than twice the average for the nine major urban areas. The relationship between drugs and other crime is complex. It could be that Cape Town has seen high and growing rates of drug abuse, and that this is driving other forms of crime for any number of reasons. It could also be that police action against drugs has destabilised drug markets, leading to more violent competition between the criminal organisations that profit from them.
Another possible reason for both the increase and dispersion of murders in Cape Town may lie in the changing contexts of the murders that are happening. National analyses of murder dockets have suggested that a declining proportion of murders can be classified as ‘social’ – that is starting as an argument between people who know each other and of which at least one was intoxicated, developing into physical violence and ending up in murder. These murders tend to be more common in areas with many social problems, greater poverty, more unemployment etc. Evidence suggests that whereas these once constituted almost all SA murders, more and more are now happening under other circumstances – namely as a result of other crime (mostly aggravated robberies), vigilantism, self-defence, gang-related factors, and taxi violence.
It may be that these other, less ‘social’ drivers of murder are more broadly distributed within the city than the factors that drive ‘social’ murders, thus accounting for some of the dispersion effect within Cape Town. It may also be that Cape Town is seeing a disproportionate rise in some of these drivers, thus accounting for city’s rising murder rates overall. Cape Town has seen a proportionately large increase in robbery at non-residential premises, for example. See the graph below:

More research is clearly required to figure out what is driving the rising murder rate nationally, what is driving the disproportionate rise in Cape Town, and what is driving the relative dispersion through the city. The Centre of Criminology will continue to contribute to this work through its focus on measuring and interpreting crime and victimisation.
- By Anine Kriegler and Mark Shaw, Centre of Criminology, 23 November 2015
